Graphical Views
Tidal Automation’s Graphical Views provide expanded on-the-fly exploration of active jobs in your runtime environment. Thanks to the variety of graphical views, the information presented allows you to answer questions from a variety of business and workflow perspectives.
Graphical views can be used in a variety of ways including:
-
Identifying bottlenecks or weak points in real-time.
-
Providing important insight into job statuses and the runtime environments in which they run.
Getting Started
When discussing Graphical Views in this guide, the term jobruns is referenced. Jobruns can include individual jobs and job groups.
Customizing Color Palettes
Color designations provide visual cues to users of Graphical Views that allow them to distinguish the status of displayed job runs. For instance, one color can identify active jobs, while another can represent waiting jobs, and so on.
To set status colors:
-
Click the View menu in the top menu bar.
-
Click Preferences on the menu.
-
Use the Status Color tab in the Job Activity Preferences dialog to customize the format color scheme of your choice.
Setting Date Formats
Tidal Automation offers a variety of date and time formats from which to select.
To choose a date format:
-
Click the Activities menu in the top menu bar.
-
Click System Configuration on the menu.
-
Click the Master tab, make applicable date and time changes in the Application Format section (lower right section of the screen). For more information about date/time format options, refer to the Date Format Selection Dialog section of this guide.
Graphical Views Selection Options
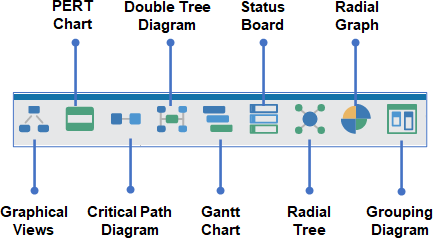
Graphical View selections can be made using the menu at the top of the screen.
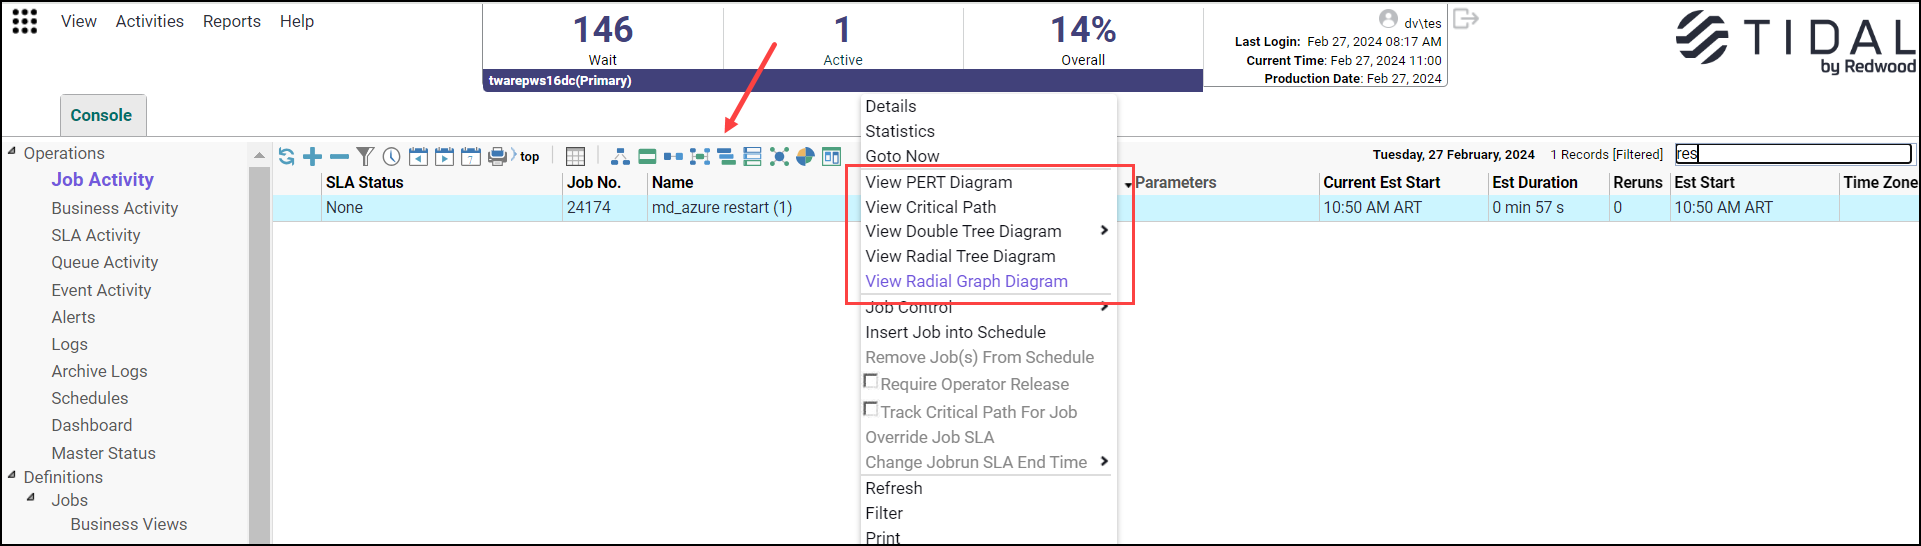
Also, by right-clicking a jobrun to display a context-sensitive menu.